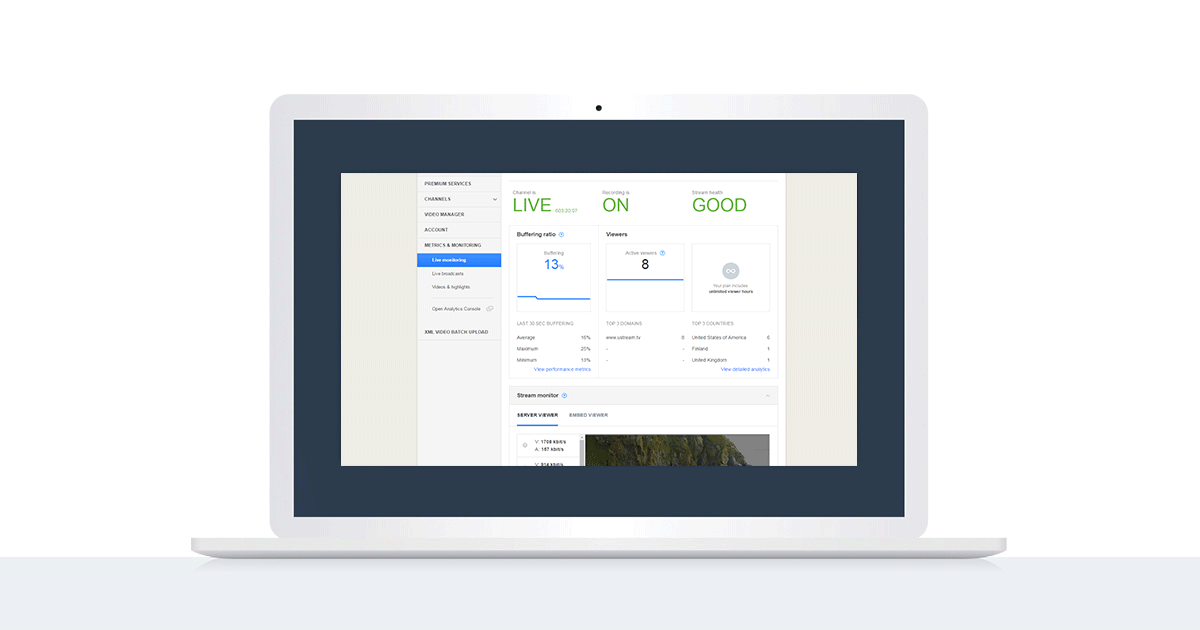
The ability to monitor, in real time, stream analytics gives enterprises a way to extract business value from data that is effectively in motion. On external facing streams, this might mean using these metrics to help further bolster attendance through promoting real time statistics on social networks such as noting impressive viewership volume. Going beyond what historical analysis could offer, this gives organizations the ability to inspect and analyze data in order to quickly respond to enhance performance or “right the ship” if the video content is not performing to expectations.
While IBM Watson Media has long had an impressive array of real-time analytics, this week the cloud platform expands with a new console that allows enterprises to monitor live stream content to an incredibly granular degree. This includes tools to investigate issues to support real-time decision making, such as validating how widespread buffering issues might be and check the overall stream health. This use case can help determine if a report of a viewer experiencing buffering issues is an isolated problem associated with the viewer’s connection or if it points to a larger problem possibly due to connection issues at the broadcaster’s side. The new console offers a wealth of use cases and increased ways to understand stream performance, from the ingest to delivery side. It also includes a visual and user interface update to the live stream analytics console as well, marking an overall update to the live metric capabilities of the IBM Cloud Video platform.
Read on to learn more about the real time monitoring and analytic features available to leverage live data regarding video channels. Also be sure to check out our Live Video Delivery System Built for Scalability white paper, which gives insights into the delivery method used at IBM Watson Media to better understand the data presented in the live monitoring console.
- Live Monitoring Console: Overview
- Live Monitoring Console: Stream Monitor
- Live Monitoring Console: Stream Setup
- Live Monitoring Console: Channel Setup
- Live Monitoring Console: Performance Metrics
- Live Broadcast Console: Real-Time Stream Analytics
Live Monitoring Console: Overview
A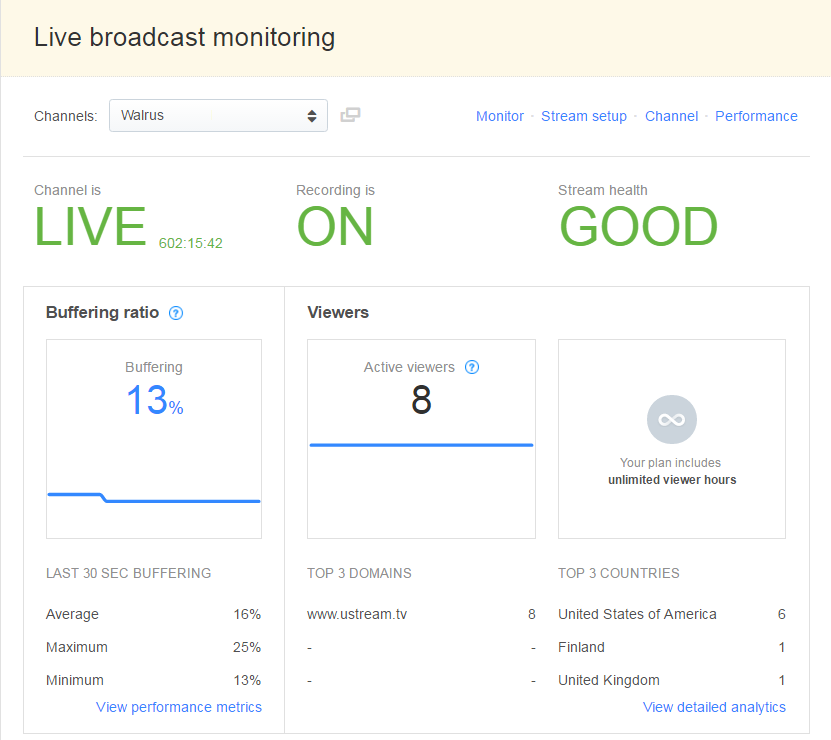 completely new feature, the Live Monitoring Console offers an impressive suite of real time tracking metrics related to a channel. This includes an overview at the top, along with navigation options to see the Stream Monitor, Stream Setup, Channel Setup and Performance Metrics.
For the overview portion, these metrics show at a glance some of the key details regarding the channel.
Channel is…
The first of these displays not just if the channel is live, but also offers a counter to note how long the channel has been live for. As seen in the example to the right, this particular channel has been active for over 602 hours.
Recording is…
The next metric is related to auto archiving, and notes if the channel is setup to record the content automatically into the account. If set to on, then previously recorded video assets will be auto added to the Video Manager, where they can be published, and tied to that channel.
Stream health
This relates to the health of the connection between the encoder being used and our ingest servers. In the example shown, the health is good. If it was denoted as poor, though, the broadcaster should check if they can improve the connection speed or connection stability of their Internet source.
Buffering ratio
The buffering ratio displayed here relates to both the broadcaster and viewer side, while showing a constantly updated snapshot of the last 30 seconds. Three stats are also displayed below which show the average buffering across all viewers, the maximum buffering someone is experiencing and the minimum amount. Of these stats, the average is the most powerful, allowing the content owner to quickly see if the buffering is something that is global or isolated.
Viewers
These stats provide a quick summary of real time channel traffic. It includes a total number of current active viewers, top 3 domains (where the content is embed and being watched) and the top 3 countries that are contributing to the viewing traffic. A point of reference is also provided for the amount of viewer hours available on the account. If the plan is Align based, however, it will instead show the amount of available seats on the plan.
Live Monitoring Console: Stream Monitor
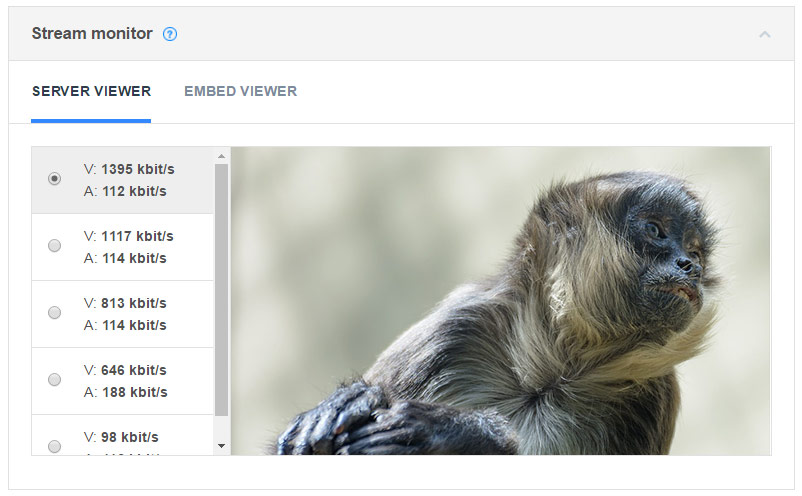 This tool offers a way to see, in real time, what is being sent to the IBM Cloud Video servers and also what IBM Cloud Video is sending to the player.
Server viewer
For content owners wanting to see exactly what they are sending to IBM Cloud Video, this view shows the video content being sent directly to the ingest servers. The top option will be the original stream that is being sent via the encoder, while options below will be the encoded versions that are being created for adaptive bitrate delivery. An exception to this can be if the content owner is sending multiple streams with differing bitrates through the encoder.
Embed viewer
This option shows a sample of the experience found inside the embedded player. Combined with the server viewer, this gives content owners a quick method to compare what is being sent to the ingest servers and how this compares to the quality found inside the player.
Live Monitoring Console: Stream Setup
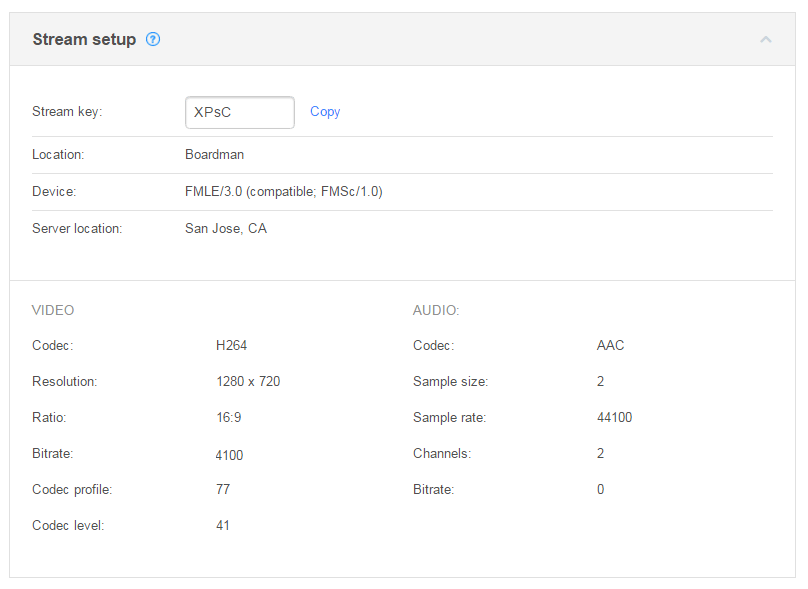 Content owners wanting to get more granular into the details being sent to the ingest servers can use the stream setup portion of the monitoring console. The stream key relates to the unique ID for the broadcast, which with the Stream URL is what’s entered manually into professional encoders like the Teradek or NewTek products.
The location denotes the geographic area where the broadcaster is, while the server location is the point of presence server being used by IBM Watson Media. The device listing gives details on the encoding source being utilized.
Below this are details on the Video and Audio sources. For video, this includes the codec, resolution, ratio, bitrate and codec details such as the profile and level. On the audio side, this denotes the codec and bitrate as well, but also includes the sample size, sample rate and channels (2 channels for stereo, 1 channel for mono, etc).
Live Monitoring Console: Channel Setup
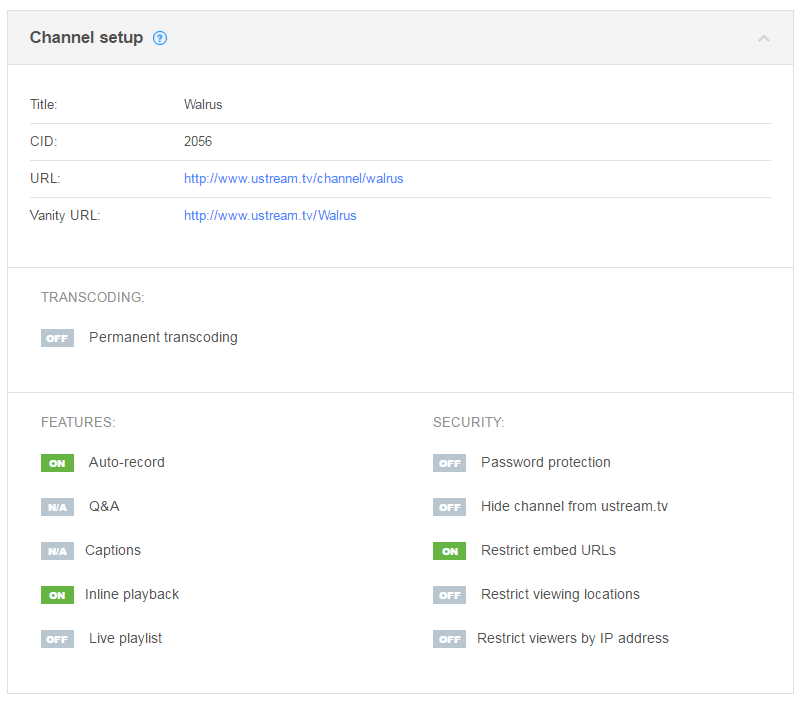
The channel setup gives an info dump on the settings and security enabled for the channel. This includes some information such as the title and channel ID (CID) along with the URL and vanity URL.
Transcoding and feature settings are also specified here. This includes auto-record (auto archiving), Q&A module, captions, inline playback (over social networks like Facebook and Twitter) and if the live playlist functionality is enabled.
At a glance, content owners can also see the security settings for the content, giving quick peace of mind if the content is secured in the desired way. This includes if password protection is turned on, if the embed URL is being restricted (controlling approved URLs for where the content can be embed), restricting viewing locations (geo-blocking), and finally also if the content is setup to restrict based on IP address (controlling distribution to only pre-approved IP addresses). If a setting is not set to the desired status, scrolling over the setting will give a link to where this feature can be changed in the dashboard.
Live Monitoring Console: Performance Metrics
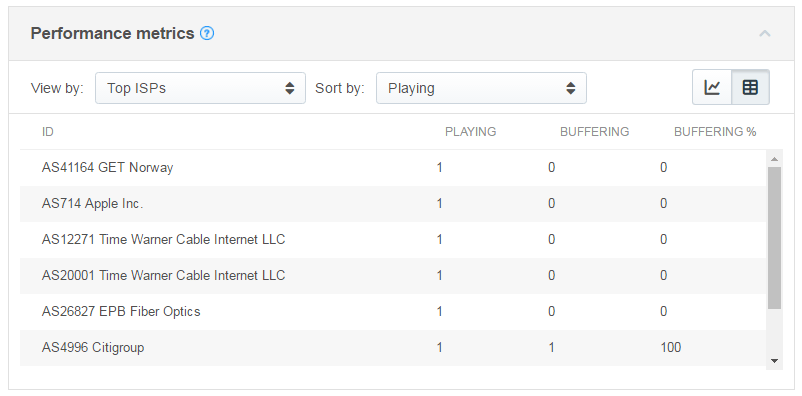 The final area of the monitoring console denotes the performance of the stream in terms of how many viewers are experiencing buffering down to a per-source view.
Chart View
This display is similar to the buffering ratio data contained in the overview area. In fact, it contains the same information, just presented in a larger display.
Table View
On the flip side, the table view is a new, very granular way of looking at this data.
With this tool set to the “Top ISPs” view, content owners can see how many viewers on a given ISP are experiencing buffering during a broadcast. For example, if a report comes in of just one viewer having issues with the content buffering, this panel allows an opportunity to learn a bit more about this user from the ISP side and also how serious the buffering is for them. Content owners can also see, under the Playing category, if the issue might be due to local congestion caused by too many viewers all trying to use the same network connection to watch with possibly insufficient download speed.
The view can be changed to “Top CDNs” to get an idea of what content delivery networks are being used to distribute this stream. “ucdn” is the Ustream CDN, while third party delivery networks will likely fill out the other delivery sources. Each is denoted with buffering information as well. If the content owner is using ECDN (Enterprise Content Delivery Network), the nodes will be listed here as well.
For a constantly updated rundown of everything related to the Live Monitoring Console, be sure to check out our Support Center article.
Live Broadcast Console: Real-Time Stream Analytics
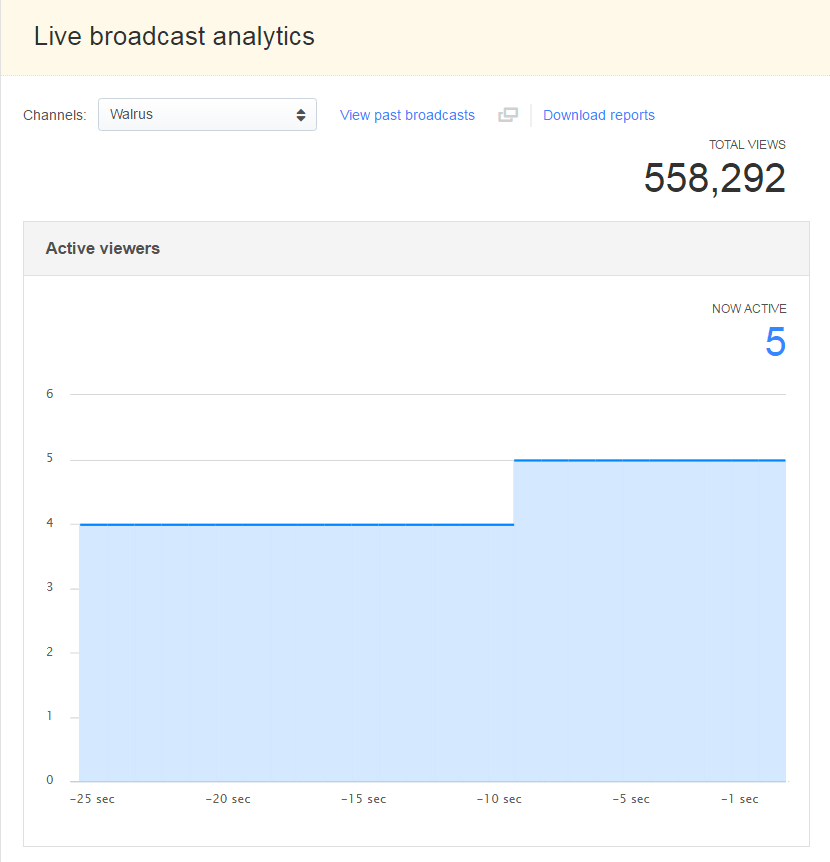 With the addition of the Live Monitoring Console, the live analytics console has been updated as well. This includes a user experience update to match the look of the monitoring console. Functionality has remained the same, but let’s refresh on what the Live Broadcast Console is capable of.
This console is broken into four sections and includes real time data in all categories. It offers content owners a powerful way to get second-by-second updates on their channel’s performance.
Active viewers
The viewers section not only presents a quick snapshot of total viewers in the upper right, but also offers currently active viewers on the stream. The “now active” metric tracks those only presently watching the broadcast, while the 30 second chart gives insight into how this number is either rising or falling.
Geographic distribution
A heat map allows content owners to see where their current viewers are located. This includes both a world map for global traffic and also an alternate view of just the United States, to segment viewership at a state level. This view can be toggled between a map view, which is the default, and a table view, to make it easier to see a list of all the countries or states where there is currently activity.
Embedding domains
A chart view can show presently where on the web people are viewing the streaming content. For example, if content was embed on www.mysite.com/videoevent that would show as a result for any active viewers watching from that page. Up to 25 domains can be listed here. The view can also be shifted from the chart view to a table view. If viewers are watching from the Ustream Mobile App this will show as a source here as well.
Devices
The last section of the broadcast analytics displays the device makeup of viewers. This can be broken up by desktop and mobile application. So for example, a stream might have 6 desktops users (5 Windows, 1 Mac OS X) and 1 mobile user (1 iOS). This view displays a pie chart on the right and a table with device details on the left.
Summary
The new live monitoring console is a powerful, real-time analytic tool for professionals to keep their thumb on the video quality that IBM provides. It gives content owners a truly live way to see how viewers are accessing content, their experiences and to learn more about details related to the content being sent to and ingested by IBM Watson Media. Combined with the Live Broadcast Console, enterprises have many methods to analyze data in motion, making informed, in the moment decisions that would not be possible through analyzing data at rest.
Want to start using real time monitoring for your live streaming? Try out IBM Video Streaming and take full advantage of IBM Watson Media’s live stream analytic capabilities.