
Need a quick way to generate a report on your video metrics for a stake holder?
IBM Video Streaming and IBM Enterprise Video Streaming accounts now have a way to generate PDF reports on their video metrics. This can be generated from viewership tied to either live streaming events or on-demand video content. Reports are generated as a downloadable asset, with charts and datasets, that can be distributed to others.
- Generating a PDF report
- Number of viewers dataset
- Viewing time dataset
- Detailed charts for video metrics
- Use cases
Generating a PDF report
There are two ways to begin generating a PDF report on video metrics. The first is to click “Metrics & monitoring” on the left navigation and then choose “Generate PDF report”.
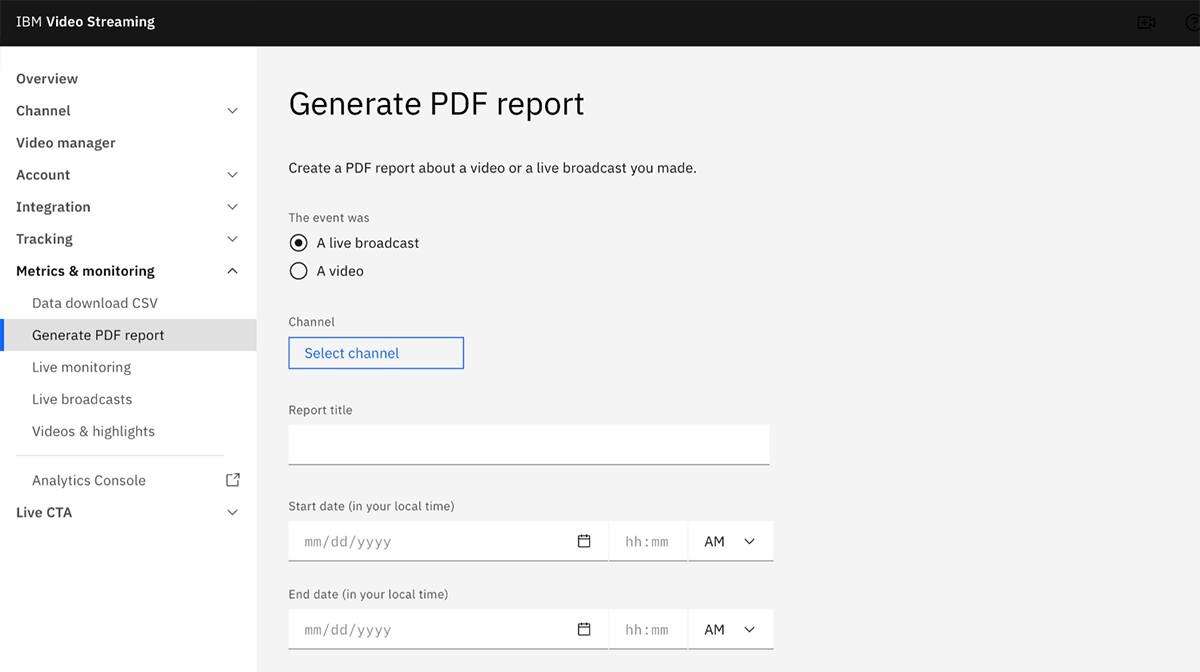
The other method is to go to video manager or view the videos at a channel level. Once you have found the video asset you want to generate a report for, click the ∨ for more options and select “Generate PDF report”.
The next step is to configure your video metrics report with the following options:
- Selecting type (live broadcast or video on-demand)
- Selecting channel
- Entering in a report title
- Choosing a date range
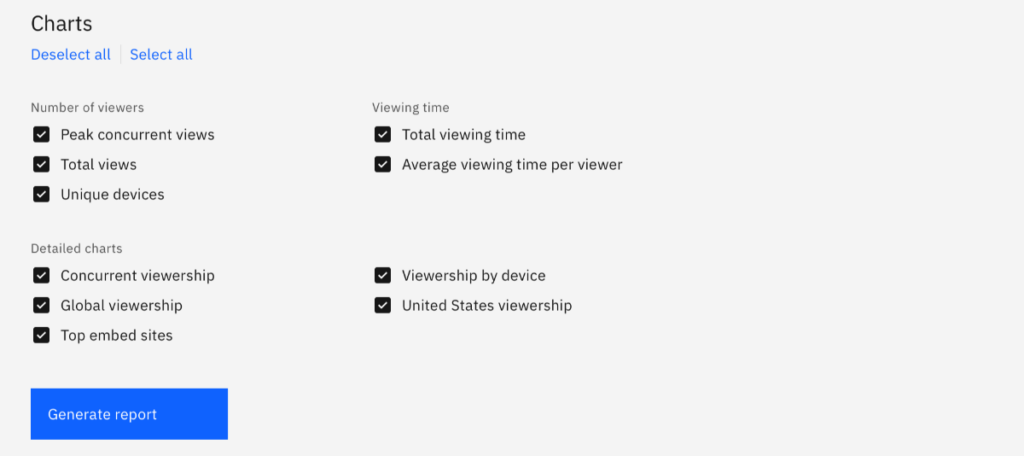
Next comes choosing which data and charts will be visible in the PDF report. These are broken up into three selections, which are:
- Number of viewers
- Viewing time
- Detailed charts
Number of viewers dataset
First up is the number of viewers dataset. This allows you to display peak concurrent views, total views and unique devices that accessed the stream or on-demand content. For IBM Enterprise Video Streaming, tracking authenticated viewers replaces unique devices in this dataset.
These all appear in the same row of the report, with below being an example of what this looks like.

At the end of the report, each of these metrics is defined as well to understand criteria. This makes it easier to hand someone the report and allow them to find answers to questions they might have on what constitutes a unique device or how concurrent viewership is tabulated. These definitions, that are found in the appendix section of the report, are included below.
Total views
Each playback of any type of media counts as one view towards the total number. It starts with a player playing any type of media and it finishes when the viewer closes the tab. If they reopen it, it will count as a new view. If they seek or pause, it will be part of that view.
Peak concurrent views
Maximum number of concurrent playbacks of live or recorded media in a given minute.
Unique devices
Number of distinct viewers that watched any type of media based on persistent device identifier. Multiple views by a single user (such as opening multiple windows or restarting the media) will only count as a single unique device. Uniqueness cannot be maintained across devices. If a user watches on two devices, it will count as two unique devices.
Authenticated viewers
Number of distinct viewers who accessed the media through authentication (based on SSO ID, SME plan). If the viewer views a content several times from different devices while logged in, it is still counted as one authenticated viewer. Note: we cannot filter out shared accounts.
Viewing time dataset
Second up is selecting viewing time data. The data points to choose here are total viewing time, a tabulation of adding viewing time of each viewer together, and average viewing time per viewer.
Like number of viewers, this appears in the same row in the report. Below is an example of what this looks like.

Detailed charts for video metrics
The last selection are related to a series of detail charts that can be added to the report. Currently there are five different charts that can be added to the PDF report. Each tracks a different aspect of the video analytics. These charts, with examples, are:
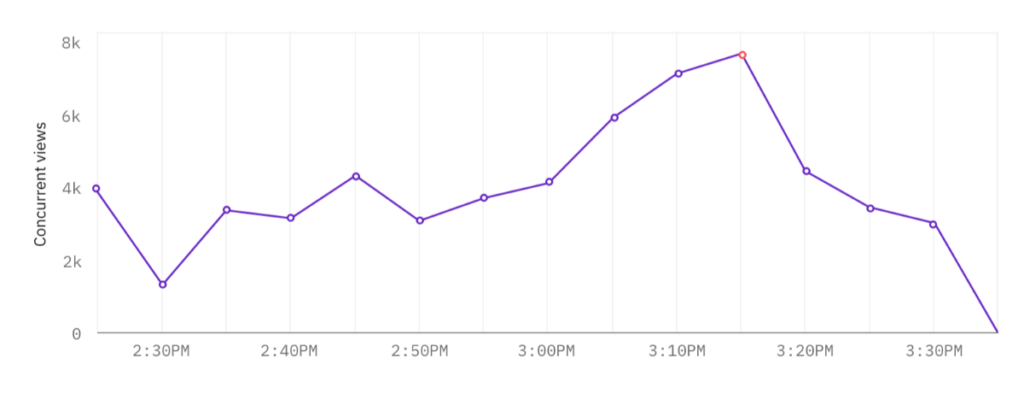
Concurrent viewership
A line graph of concurrent views, showing dips and rises over the designated period. Also includes written data points below the chart for what was the peak concurrent views and the moment that those peak views happened, down to the minute.
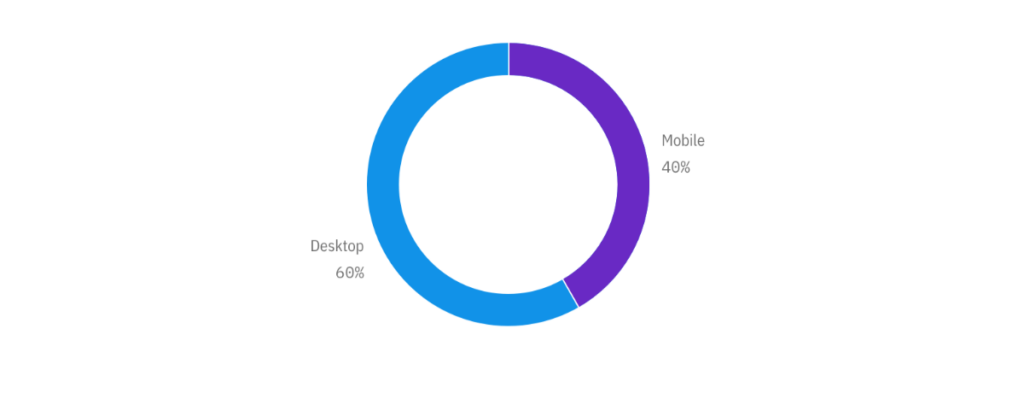
Viewership by device
Breaks out viewership of the content by device. This is done on a mobile versus desktop basis. The chart is presented as a pie chart, with a ring design.
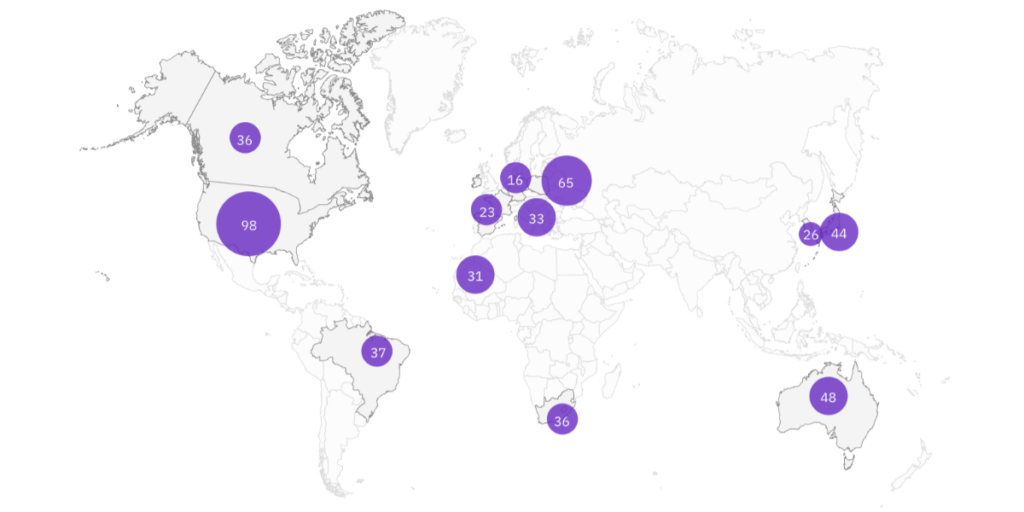
Global viewership
Presents viewership on a global, geographic level. Displays a world map with circles on countries with a number inside related to viewership, based on unique device views in that area. Below the map is a list of the top 20 countries by unique device, with the number of unique devices shown next to each country name.
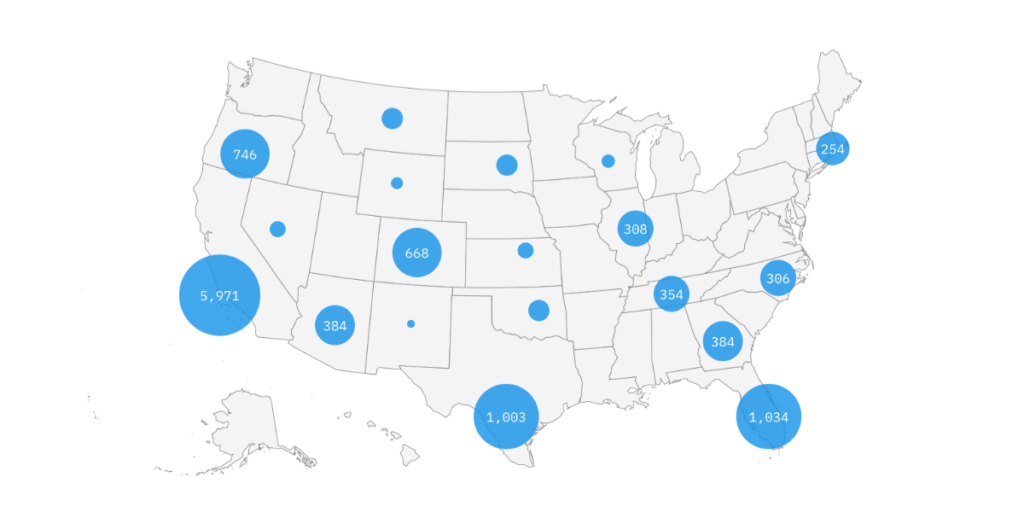
United States viewership
Displays viewership at a geographic level again, although this time just for the United States. Presented on a map of the US, the chart shows which states viewed the content during the period through circles that include that viewership number. Similar to the global viewership chart, the top 20 states are shown below the map with a unique device number next to each state name.
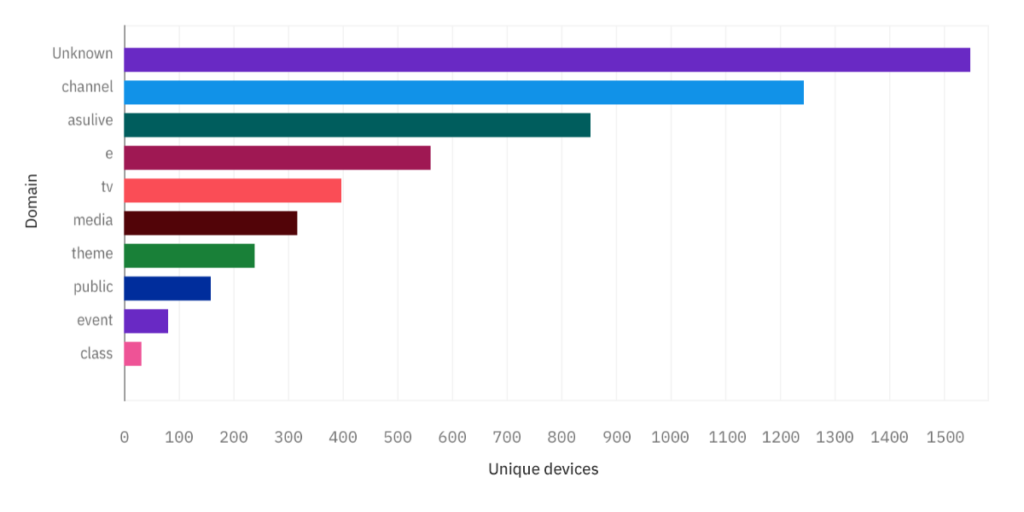
Top embed sites
Breaks down viewership by source. This includes the default channel, available through an IBM Video Streaming account, and locations where it’s embed. This is presented as a bar chart using unique device viewership as the metric.
Use cases
IBM Watson Media has introduced user permissions to grant various levels of access to an account. Regardless, there are times where it’s much more desirable to generate someone a report on viewer data rather than give them access to the account so they can do so themselves. Here are some use cases for this feature:
- Live event streaming: concluding a virtual event, organizers can be looking to provide data to sponsors, exhibitors and other stake holders. Being able to generate a report for them during the whole event, or narrowed down to the window of their sessions, can be extremely valuable.
- Virtual events with guests: bringing in a subject matter expert is a great way to broaden an audience. It’s also customary to share some data with them post event, and this feature allows content owners to select exactly what information they are sharing in the report.
- Executive communication: those conducting this level of communication, like CEOs or CMOs, are rarely directly involved with their enterprise video platform. That said, they can often desire to get a sense of who was watching. Providing them a metrics report can help answer that question while the turnaround time can be quick for handing them this data.
Summary
The ability to generate and distribute a video metrics report while handcrafting what data is included or excluded opens up a variety of additional use cases. It also streamlines post event processes, being able to quickly generate reports for others.