
There’s a gold mine of data in live video streams — data that can guide communications programs and help organizations refine future presentations. Important engagement clues are buried deep in the data: How long are viewers actually tuning in to company video? Are they responding to calls to action? How often are they engaging?
During any live stream, metrics are key for assessing performance, spotting trends and honing everything from a video’s message to its quality. Here are four impactful (and often overlooked) data points to collect from your live video analytics to get a complete picture of the event’s success.
1. Watch time
Perhaps the most important data point for businesses to track is how long a viewer watches a streaming presentation. By extension, watch time also indicates whether the presentation is compelling enough to convince viewers to stick around.
“You need to be looking at your overall watch time in terms of all of your viewers,” says Sean Martin, marketing manager at Directive Consulting, which creates streaming video to support its thought leadership about SEO. “This will give you some actual insights into where in your video users are losing interest and bouncing off.”
With this data, Martin says, producers can fine-tune streaming presentations to prevent that drop-off. The solution might be as simple as shortening the live stream’s duration. Martin also recommends adding a fun speaker or an interactive activity before the average “bounce time” occurs. That just might convince viewers to stick around longer than they normally would.
2. Call-to-action responses
Viewership and quality metrics are essential, but smart marketers remember why they’ve invested in streaming video in the first place. Streaming efforts should be designed to drive an end result such as encouraging a prospect to visit a website, buy a product, or connect with the company on social media. Whatever the goal, track response to that call to action. It might sound obvious
“If you notice the places you are sending people to are not experiencing an uptick in new sign-ups or traffic, either you need to change how you deliver your call-to-action during your streaming video or test different ones to see which ones resonate best with your audience,” says Christian Karasiewicz, who uses streaming video as social media strategist and founder of social media training website Social Chefs.
A method to achieve this is through clickable video overlays. As seen in the image below, these push a prompt on the screen for the viewer to take a specific action.
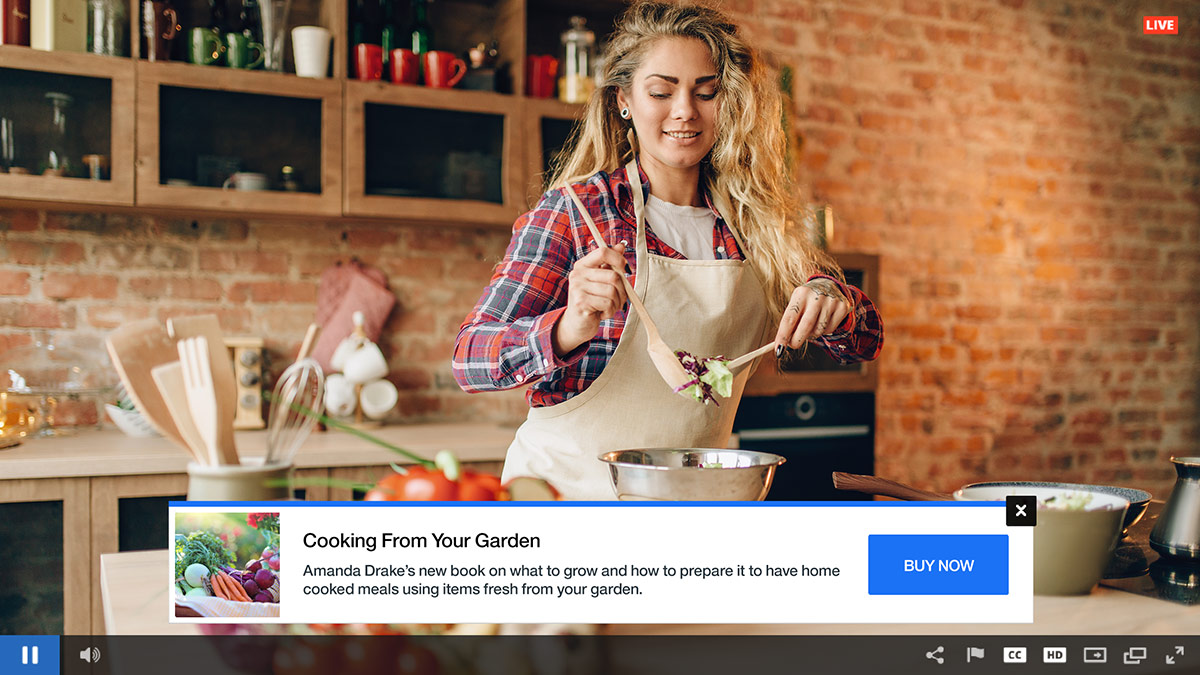
When clicked, they can lead the viewer to a desired URL. This can be a great way to push the viewer to the ultimate desired action, like a purchase or to register for something. It can also help determine the quality of the audience being attracted as well. For example, if you have a large number of raw viewership but they aren’t actually following through on the CTA, it might mean either the CTA isn’t strong enough or that the audience isn’t a good fit for your ultimate goal. In terms of tracking, a good method is to utilize UTMs (Urchin Tracking Module) to tie specific CTAs or specific content around success metrics. This is done through including them in the URLs being used by the video overlays.
Learn more about Live Video CTA: Add Clickable Video Overlays.
3. Quality-of-service metrics
The technical smoothness of streaming video presentations has a major impact on whether viewers watch — that is, if they can even watch in the first place. Matching quality-of-service measures (bitrate and rebuffering ratios, among others) with metrics like watch time and video start time can help explain why viewership is falling off — or improving.
“Optimizing these metrics is the holy grail of delivering broadcast-quality streaming video,” says Simon Jones, director of marketing communications at online traffic management company Cedexis. “From the perspective of the viewer, what matters is how long it takes for playback to start, how good the picture is, and how much time is wasted staring at the spinning wheel of frustration as the player catches up with the stream.”
4. Average minute audience (AMA)
This is a metric used by the TV broadcast industry, but it can also be helpful for gauging the impact of streaming video. AMA looks at concurrent viewership in an average minute of a video stream. The AMA metric is useful, says Luke Watson, director of live streaming company Roker Labs, because it provides a “universal measure” of the size of an audience and can be used as a helpful KPI when comparing audience numbers across streams.
“It also mitigates issues caused by viewership fluctuation, which is especially common in live streaming video,” Watson says. Since viewership can change from minute to minute, you should look at averages, not just metrics from one or two points in the video stream.
No matter whether a video is intended to entertain or educate, reach a large external audience or a small internal one, Watson says the measures of success remain consistent. By collecting the same metrics across every streaming video delivery, companies can build credible data about the value of their presentations and fine-tune their efforts for even better results.
A “postmortem” can also be done on the content to gleam even more insight on particular assets as well. Below is a sample view taking from an IBM Video Streaming account, available for both live and on-demand content.
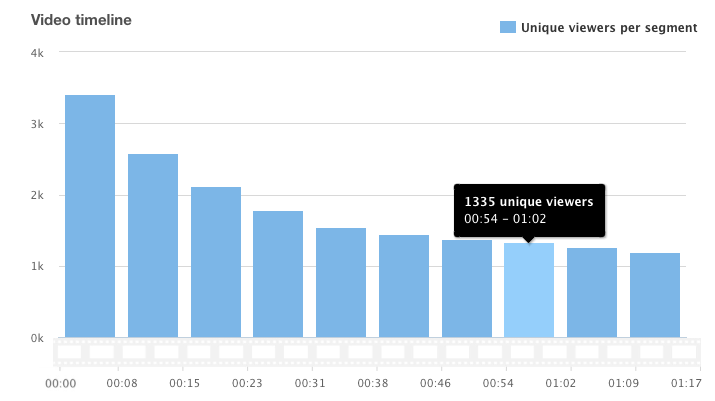
This can showcase the exact time where a drop off might have occurred, which could be invaluable for approaching content creation in the future. For example, maybe there is a major trend where viewership drops off if a Q&A segment lasts more than 10 minutes, which might help inform hosts that they need to tighten that aspect up in future content. Alternatively, they might find that the audience during the first few minutes of a live stream is relatively small, and builds overtime. This could help them to craft content that warms up the crowd early before diving into the agenda and other important aspects that might normally be missed by those coming in late.
Summary and Execution
There’s a host of data that comes from a live video stream, and its important to track the best metrics. Not just viewer numbers, for example, but viewer watch time: how long did the average viewer stay engaged? This metric, along with quality of service metrics, CTA responses and AMA data can help organizations make the most of each and every live stream.
On the execution side, IBM Watson Media offers a wealth of live video analytics, both during and after a broadcast. Metrics available during a live stream include a look at who is watching now, what device and geographic data. In addition, though, QoS (Quality of Service) tracking is also available. Found through a Live Monitoring Console, content owners can check the stream in real time, various bitrates and also see how many of their viewers might be experiencing buffering as well.
Post broadcast, content owners can track watch time and check the all important gauge of viewership at specific moments during the live stream. This can gauge if certain moments might have not caught their interest and viewer churn increased during these times in the broadcast. Content owners looking to generate leads for their marketing activities, though, can also track usage on a more personal level. In fact, they can get data on a per viewer basis through individual viewership data. This can be used to qualify leads, telling you if a specific prospect watched all of a video or what content they watched afterwards, and also identify prospects that sales should reach out to through content that is seen as solution specific like a product demonstration.
Want to start putting live video analytics to work for you to better your video performance and improve your content? Sign up for a free trial and start testing these features out.