
As the COVID-19 pandemic developed, and with it the need to social distance, our IBM Enterprise Video Streaming customers moved more and more of their communication online. As a video streaming provider focused on helping customers share communications securely, IBM was at the forefront of these changes. We provide a solution for remote communication needs, such as training classes, company-wide broadcasts, executive town halls, digital events and virtual conferences. For example, we provided the streaming solution for the extremely successful two-day IBM Think 2020 Digital conference, leveraging the security rich aspects of the platform.
The need to social distance, work remotely and the cancellation of many in-person events has impacted how video streaming is being used today. For this report we gathered live video streaming statistics on how our clients use the IBM Enterprise Video Streaming solution for internal communication (i.e., employee communication). This covers data points like the frequency of live streaming, content length and information around viewership. The data is intended to help you formulate your own plan relating to your corporate communications.
Note: to avoid test broadcasts from being factored into the results, live streams with less than 10 viewers were removed from this study. Also, this data only focuses on live authenticated viewers and does not account for additional viewership or time spent on content from on-demand viewing of the same session.
- Broadcast regularity
- Broadcast length
- Authenticated viewers
- Relationship between duration and audience size
- Viewer engagement
- Suggested practice
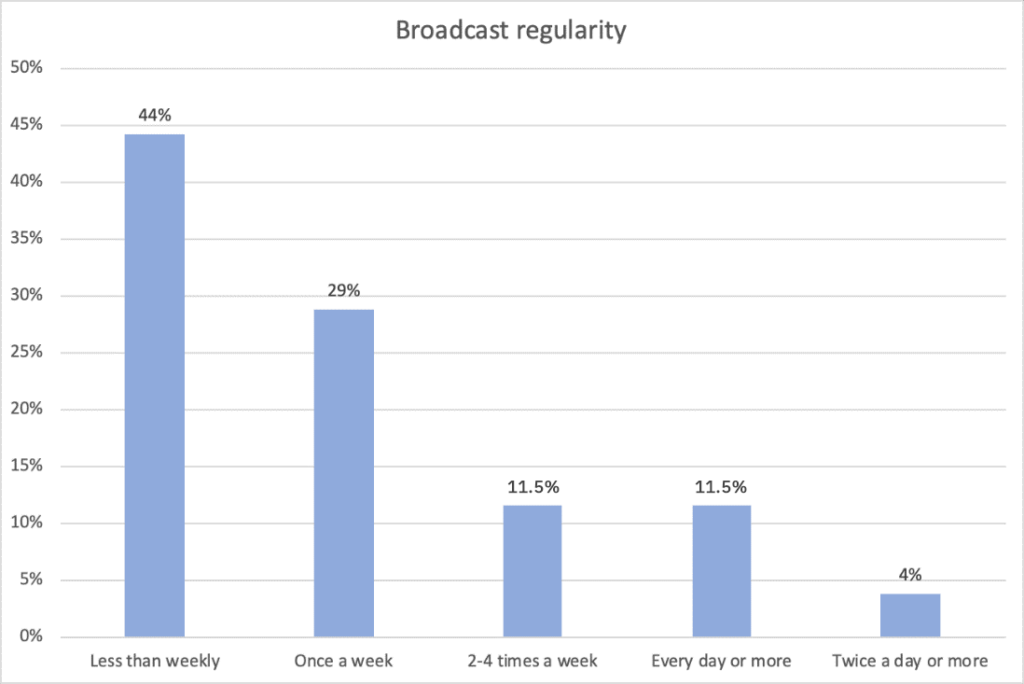
Broadcast regularity
Social distancing and being remote requires more frequent online communication. More than half of our customers (56%) are holding broadcasts at least once a week. 18% of our customers communicate on a daily or more regular basis.
Some companies even have more than two broadcast every day. That might seem like a lot, but keep in mind this is a mixture of corporate communication use cases. There are a wide range of uses for IBM Enterprise Video Streaming from training, on-boarding, streaming meetings to a wide audience, executive communication and much more. As a result, a company with several thousand employees and a company-wide adoption of video streaming can generate a lot of broadcasts.
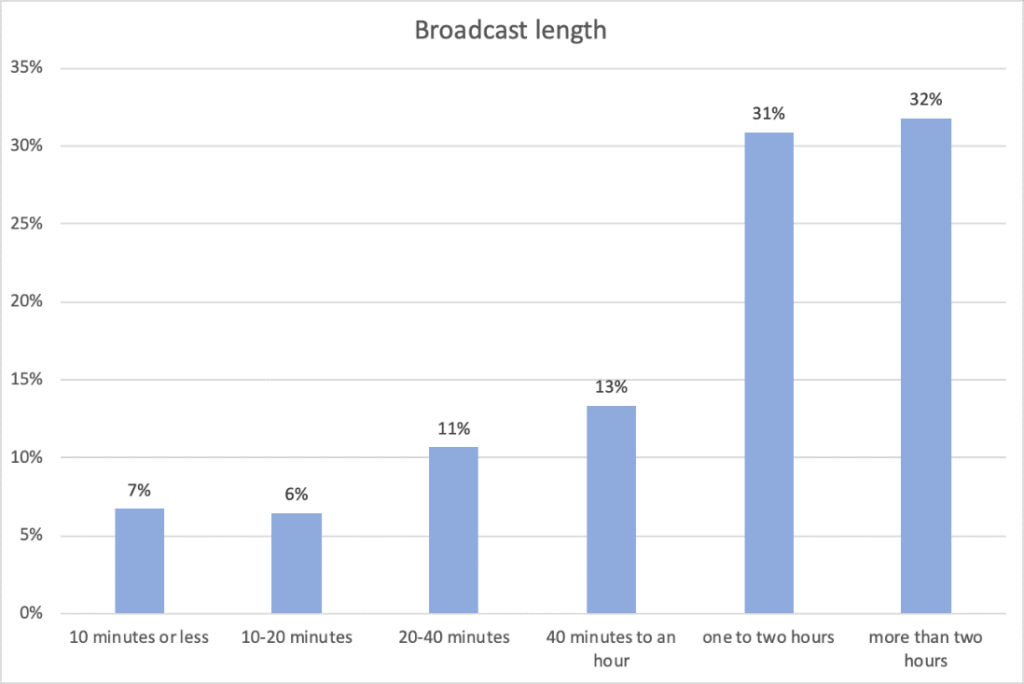
Broadcast length
Both broadcast regularity and length suggests that producing a broadcast can be a big effort in some organizations. The majority of broadcasts (63%) are longer than an hour. From user interviews we know that different use cases translate into different lengths for live streaming. The broadcasts below can vary between something with a lot of scale, like a huge sales kickoff conference, to something a bit more intimate, like unit/team level communication. IBM Enterprise Video Streaming is a versatile platform that handles this diverse need for internal one-to-many communication.
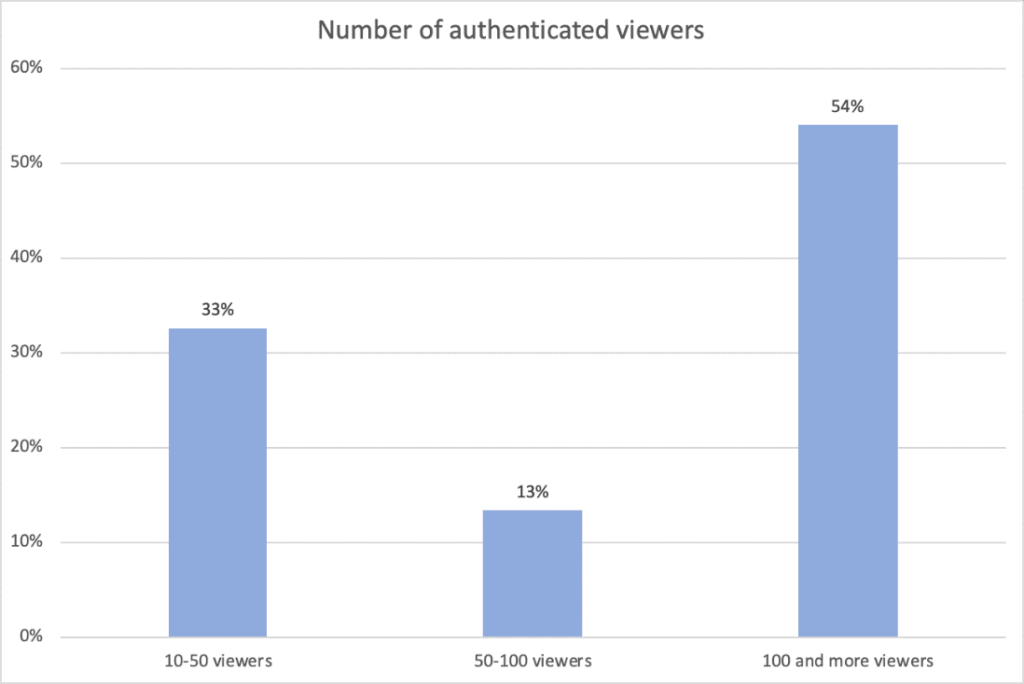
Authenticated viewers
Another metric that tells us a lot about the usage of IBM Enterprise Video Streaming is the number of authenticated viewers on broadcasts. Our data suggests that the two main use cases are team level and company-wide communication. From our qualitative research we also know that one of the first things a company tends to use our platform for is company town hall events (“all hands” communication). Along with the larger event use cases, explains the overwhelming share of 100+ viewer broadcasts.
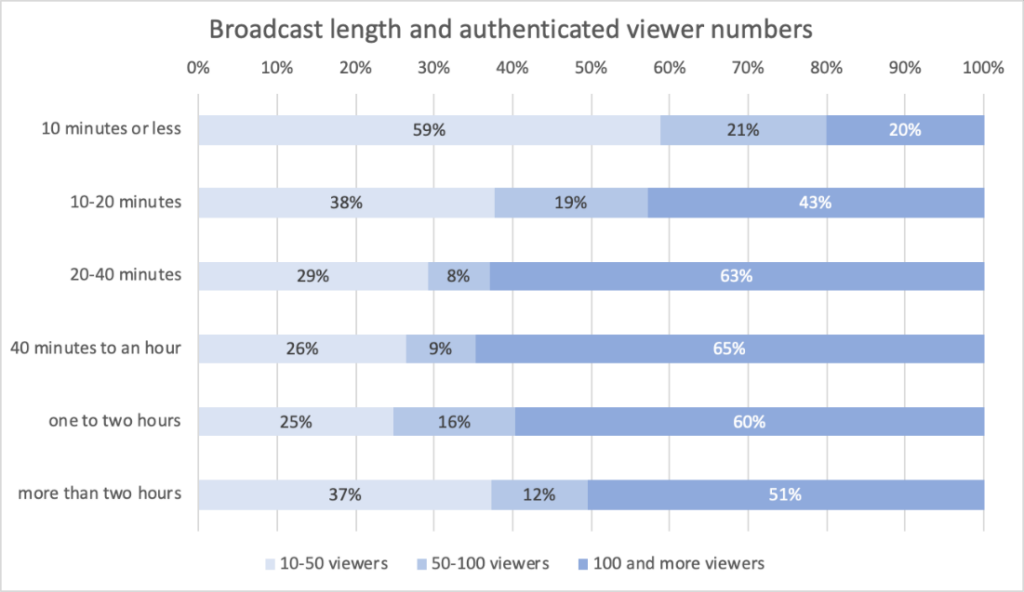
Relationship between duration and audience size
An interesting element from the data was the relationship between the length of the broadcast and size of the audience. Perhaps not surprisingly, short streams less than ten minutes rarely attract over 100 viewers (20% of the time). On the flip side, that majority of broadcasts that lasted between 20 to 120 minutes had over 100 viewers (all over 60%). The winner in that regard was content 40-60 minutes long, 65% of which had over 100 viewers.
The relationship between duration and audience size makes sense as it’s generally a huge effort to gather the whole unit/company. When it happens, it seems natural to communicate a bigger chunk of information which requires at least 20 minutes.
Viewer engagement
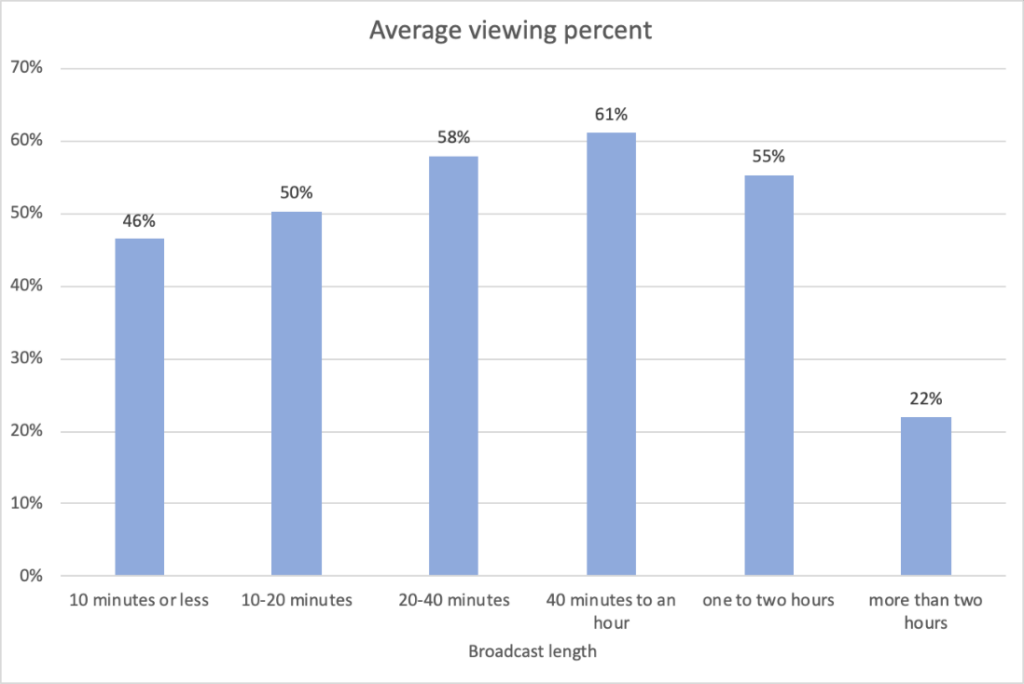
From the broadcaster perspective, it is important that the message gets through to the viewer. A good proxy for that is how long the viewer watches the live stream. One thing to note is that all content between 10 minutes all the way to 120 minutes has at least 50% of the total length watched on average. The number that sticks out from the chart below, though, is that viewers only watch about 22% of the total content length for streams which are more than two hours long. In this case we must be careful in how we interpret this information. In addition to acknowledging normal human attention spans, streams longer than two hours are likely online conferences or events, where it may not be necessary to watch the whole thing live. Many participants may be tuning in just for a specific speaker or topic, and many may also return to watch the portions they missed later on-demand.
Suggested practice
Several data points from this study point to broadcasts being between 40 minutes to an hour as a possible sweet spot. One data point is that the engagement rate is the highest for this length, with on average the viewer watching 61% of the available content. This type of content also has the highest viewership of over 100 viewers, at 65% of broadcasts this length. That said, this is a somewhat uncommon duration for events as well, with only 13% of broadcasts coming in at this length.
The majority of content being broadcast is actually over an hour long. Furthermore, while the % of available content watched is lower, the number of minutes the average viewer watches is much higher on an hour to two-hour broadcast. So if your goal is to measure length of engagement, rather than % of available content watched, you’ll get the most benefit keeping your content over an hour long but under two hours in length.
Beyond playing with the length of content, another suggested practice was around interactivity. From looking over the data, it was discovered that interactive features had a positive effect on viewer engagement. In fact, broadcasts with chat, Q&A or polling had an average of 55% of all available content watched, versus 47% for those that didn’t leverage these features. So for those looking for other ways to keep viewers tuned in, submitting a poll or allowing viewers to ask questions can go a long way toward keeping audiences engaged.
Live video streaming statistics summary
With these insights in mind, we suggest that companies experiment with different formats in length and audience size against goals for content engagement. While there are suggested parameters, there isn’t a silver bullet. A company’s culture, the type of information being discussed, and other factors can lead to a wide variance. Luckily, we provide an Analytics API where customers can download viewer data on a granular level and can reproduce all these charts above (in fact we used it to write this article). The more use cases covered by IBM Enterprise Video Streaming, the more it will be part of the company culture and the easier it will be to experiment to find the sweet spot in terms of duration and engagement for your audience.
Looking for more data related to streaming practices? Download this Gauging Demand for Enterprise Streaming 2020 report. It interviews over 2,000 executives, looking to highlight growth areas and signs of momentum in the adoption of online video for business.